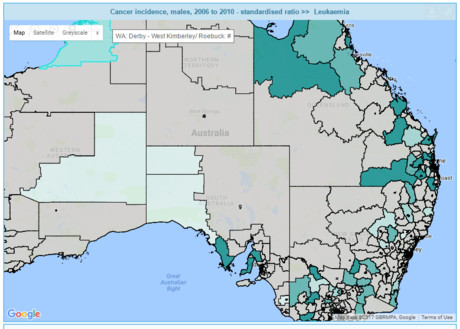
Cancer map: first national atlas on cancer incidence in Australia

Queensland has the highest incidence rates for major cancers in men and women, and there is a 20% lower incidence of breast cancer for females in very remote areas, when compared with the major cities. These are examples of insights possible thanks to the first national map showing cancer incidence by community and locality, including state and territory.
The Social Health Atlas, released by the Public Health Information Development Unit (PHIDU) at Torrens University Australia, also shows cancer incidence by Local Government Area and Primary Health Network.
The Atlas allows for comparison between cancer incidence and other data sets, such as socioeconomic status (using a measure of disadvantage that summarises economic and social conditions of people and households within each Population Health Area) or birthplace (Australia, or selected overseas countries). In this way, associations at the small area level can be highlighted.
“This research on cancer incidence ... positively contributes to the nation’s social justice and wellbeing, and should lead to improved health outcomes over time,” said Professor John Glover, director, PHIDU at Torrens University Australia. “In this latest release, users of the Atlas can clearly identify cancer incidence by a range of variables and by location, which is an Australian first.”
PHIDU has been particularly focused on the use of small area public health statistics and an online interactive website with accompanying maps, data and graphics to assist in the better targeting of prevention programs to minimise the incidence of mortality, illness and injury,” said Professor Glover.
Key findings of cancer incidence in the Atlas:
By state and territory:
- Queensland has the highest incidence rates for major cancers in men and women.
- This is also true at the small geographic area level mapped in the Social Health Atlas of Australia. For example, for men, 14 of the 16 highest rates in these small areas, called Population Health Areas (PHAs), across the country for prostate cancer are in Queensland. Similarly, for bowel cancer, 21 of the highest 25 rates were also in Queensland. However, Queensland also has the largest number of PHAs without any of these cancers. Similarly, for breast cancer for women, 29 of the 30 PHAs with the highest rates were in Queensland; and 27 of the 30 lowest rates, many with no breast cancers diagnosed, were in Queensland.
By socioeconomic status:
- Of the capital cities, Darwin has the largest disparity between PHAs for prostate cancer incidence (72% lower in the most disadvantaged compared with the most well off areas), followed by Sydney (where the gap is 38%) and Brisbane (32%).
- The socioeconomic gap is likely, in part, to reflect greater access to, and use of, preventive health services by people in more advantaged areas; this is of particular relevance for the diagnosis of prostate cancer.
- Darwin has the largest disparity between the most well off and the most disadvantaged areas for breast cancer, with the rate for females in the most disadvantaged areas again 72% lower. Brisbane and Sydney have the widest socioeconomic gaps of the larger capital cities, of 35% and 26%, respectively.
- In all of the capital cities other than Brisbane, areas with high rates of lung cancer for males were strongly correlated with socioeconomic disadvantage (and, in Hobart, the correlation was very strong). For females, the association was less consistent, with strong correlations in Adelaide and Perth, very strong correlations in Hobart and Darwin, and weak or no associations in the other capitals. Despite the lack of correlation with the summary measure of disadvantage in Brisbane, there are weak correlations with poorer education outcomes.
- For females diagnosed with breast cancer correlations with socioeconomic disadvantage are moderate to weak, other than in Sydney (strong) and Darwin (very strong).
By remoteness:
- Across Australia, there is a 20% lower incidence of breast cancer for females living in the very remote areas, when compared with the major cities. However, there is relatively little variation in rates between the intervening areas — inner regional, outer regional and remote — and major cities.
- The difference in rates across these remoteness classes is much larger in some states, with the rates of breast cancer incidence in the very remote areas of Western Australia 42% lower than in major cities.
- The remoteness differential in the Northern Territory is 31%, and in South Australia it is 23%, with less than 10% variation in New South Wales, Victoria and Queensland.
- Of the cancers in this analysis, lung cancer for men and women, and head and neck cancer for men had consistently higher incidence rates in the most remote areas.
The atlas is available to the public at www.phidu.torrens.edu.au.
Note: The cancer registries in each state and territory have approved the publication of these data by PHIDU at Torrens University Australia, which were released through the Australian Cancer Database at the Australian Institute of Health and Welfare. Publishing data by these small areas means that numbers of cases are often relatively small; caution should therefore be exercised in using the data. As the data is updated over time, we may well see consistency in some of these rates, particularly those that appear to be inconsistent/at odds with other data.
Have Australian researchers discovered the secret to treating sepsis?
Promising results from a Phase 2 clinical trial have Australian researchers looking to progress...
Could this tailored heart pump transform care for half of heart failure patients?
Half of the 64 million people living with heart failure have no access to heart pump treatments....
Breastfeeding challenges healthcare professionals should be prepared to address
A neonatal nurse and lactation consultant sets out what she sees as the most common breastfeeding...

![[New Zealand] Transform from Security Awareness to a Security Culture: A Vital Shift for SMB Healthcare — Webinar](https://d1v1e13ebw3o15.cloudfront.net/data/89856/wfmedia_thumb/..jpg)
![[Australia] Transform from Security Awareness to a Security Culture: A Vital Shift for SMB Healthcare — Webinar](https://d1v1e13ebw3o15.cloudfront.net/data/89855/wfmedia_thumb/..jpg)


